
Catalogue app
Mobility of a place
How many cars there are and where the roads run tell you how a place is built. Accidents tell you how it ends — and that is the only measure that exists for all 7,896 municipalities, twenty-four years running.
The app travels inside the link: it opens in your browser and stays there. No account, nothing to install, and none of your data passes through a server.
What it does
You pick a municipality at the top and the five pages fill up. All 7,896 of them, not just the provincial capitals.
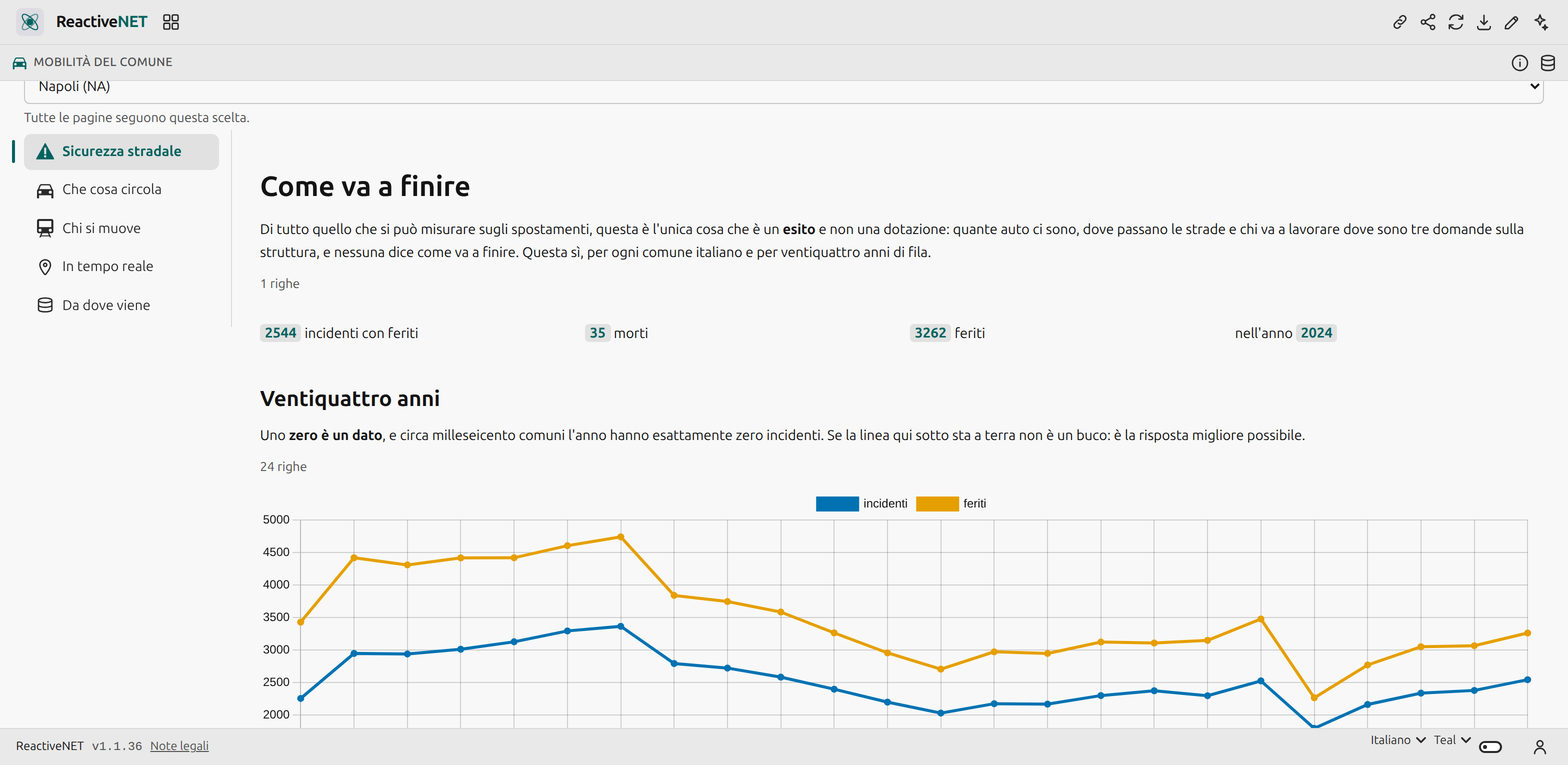
Road safety is the page that justifies the app. Of everything you can measure about movement — how many cars there are, where the roads run, who travels where to work — this is the only one that is an outcome: how many injury accidents, how many killed, how many injured, every year since 2001. Below the series sits the comparison you need in order to read it, because the number alone says nothing: the rate per ten thousand residents for the municipality, next to the province, the region and Italy.
What is on the road counts the vehicle fleet by Euro class and highlights the share registered before 2006 — the share that decides who is shut out the day a city closes its centre to the most polluting cars.
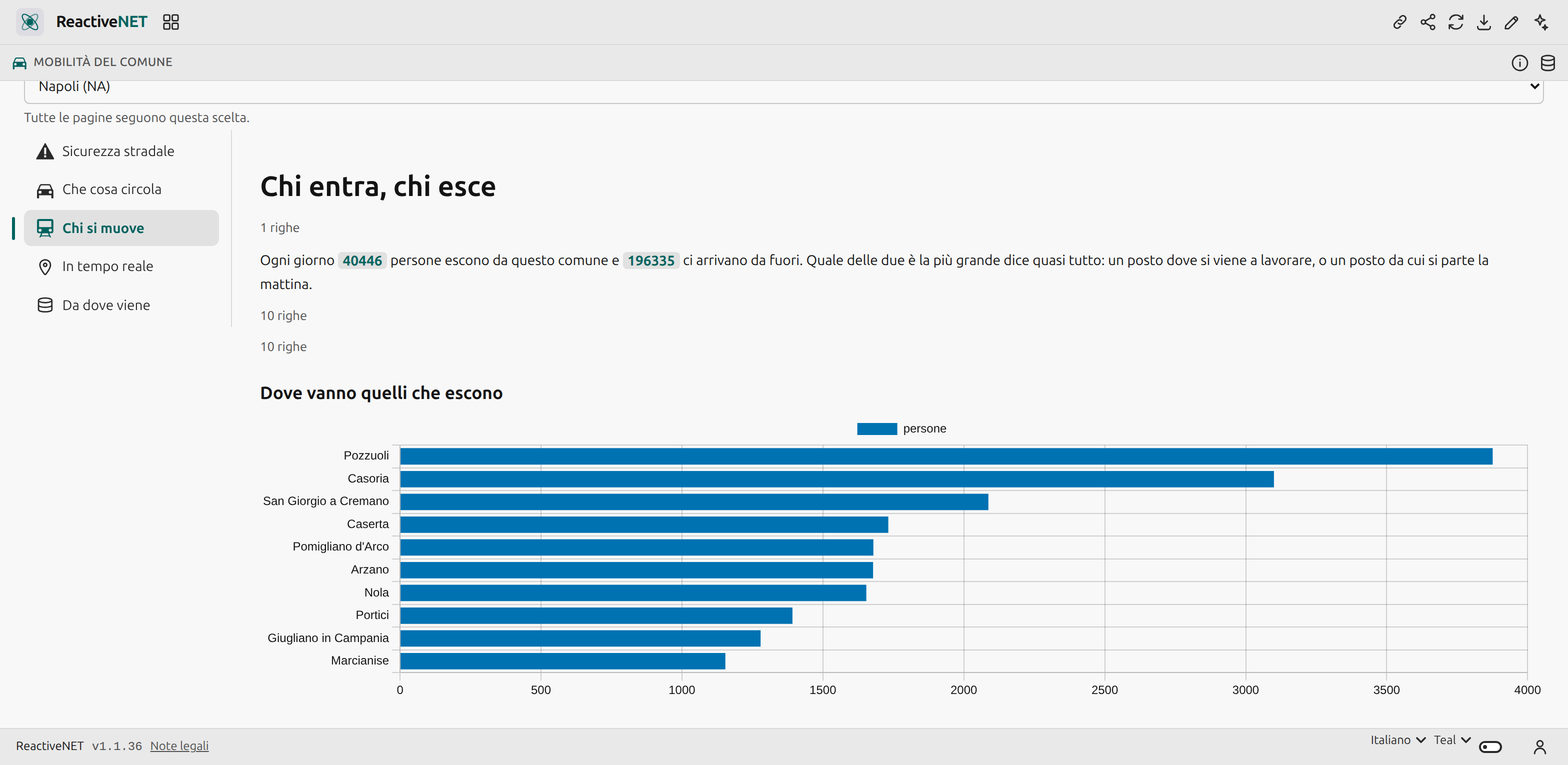
Who moves opens with the two numbers that say almost everything: how many people leave each day and how many arrive. Below, the ten municipalities most travelled to and the ten most travelled from, and the split by means — on foot, car, bus, train.
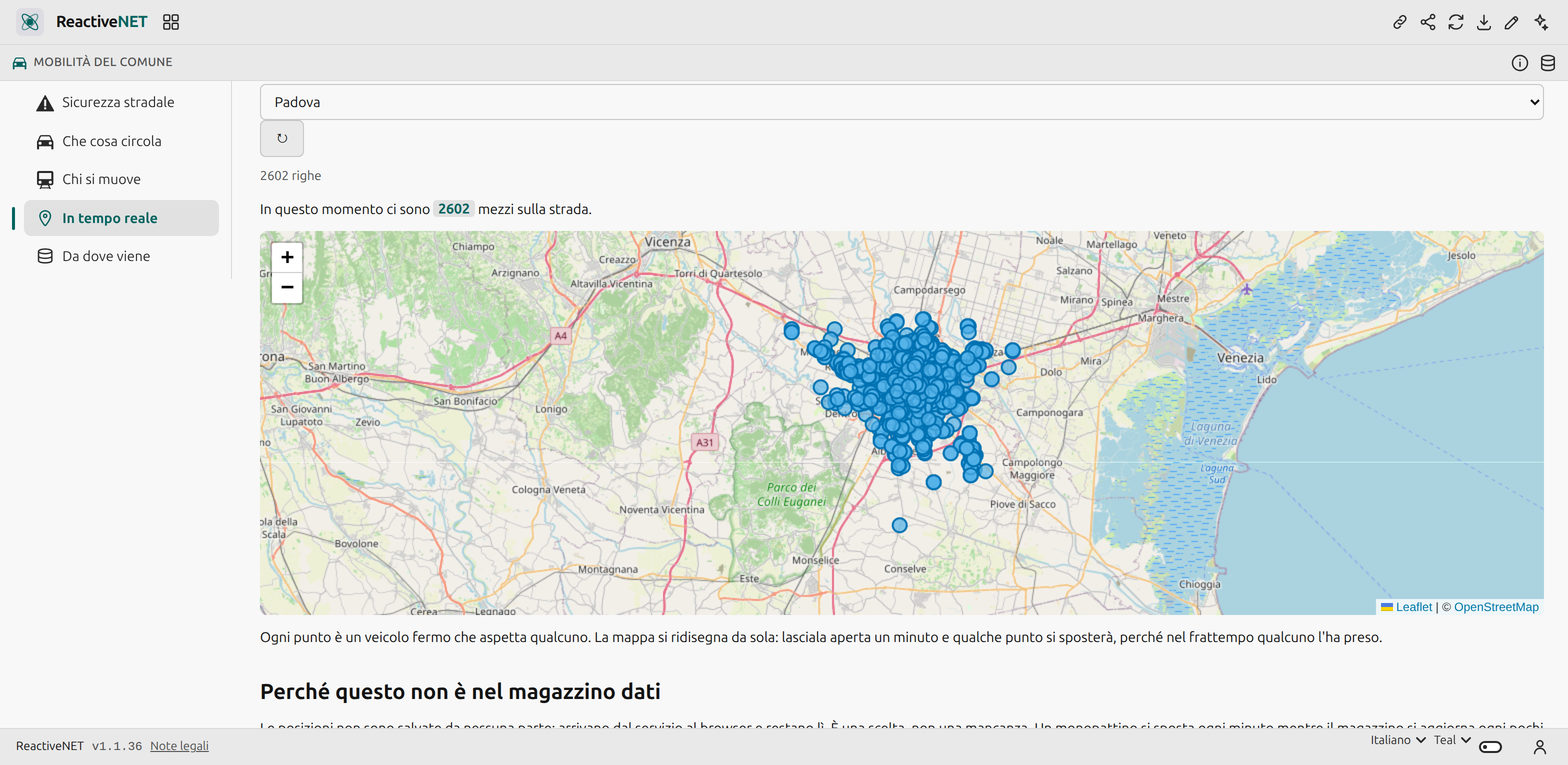
Live is the only page that is not a time series: it asks a public service where its shared vehicles are at the moment you are looking, and refreshes itself every minute.
The limit, better said upfront
Real time in Italy exists where sharing exists, and no further: of 7,896 municipalities, twenty-three have a system that answers. That is not a choice of the app — it is that the National Access Point, the aggregator a European regulation requires for public transport timetables, currently does not answer requests. The day it comes back up, half the country’s buses can go on that page with nothing else changing.
For the same reason the app does not show traffic: nobody publishes it openly and uniformly per municipality.
Where the data comes from
| What | Source | Vintage |
|---|---|---|
| Accidents, killed, injured | ISTAT — road accidents by municipality | 2001-2024 |
| Vehicle fleet by Euro class | ACI — Autoritratto | latest available |
| Who comes in, who goes out, by what means | ISTAT — commuting matrix | 2011 |
| Resident population | ISTAT — demographic balance | latest available |
| Shared vehicles | GBFS, published by the operators | now |
Two warnings the app repeats where they matter, because they are the kind of thing that makes a correct number read wrongly.
The vehicle fleet is the Public Vehicle Register, that is where a vehicle is registered: large rental companies register whole fleets at a handful of addresses, and the municipality of Trento comes out with more cars than Naples against a hundred and eighteen thousand residents. That is how it is at source.
Commuting is from 2011, and not by choice: the 2021 Census matrix has been published but the channel through which data is downloaded does not serve it. Fifteen years span the spread of remote work, so those numbers should be read for the structure of the ties — who gravitates towards whom — far more than for the quantities.
How it is built
The vehicles’ positions are not saved anywhere: they travel from the service to the browser and stay there. That is a choice, not an omission — a vehicle moves every minute while a data warehouse refreshes every few days, so a stored snapshot would be stale data that looks live, and data that looks live deceives worse than data that is absent, because nobody goes to check it.
Everything else is a query against the open-data warehouse with the municipality code passed as a parameter: changing municipality does not reload the page, it re-runs the queries.
Yours to change
An app is a Markdown document: open it, edit it by hand, or ask the assistant to change it for you. Whatever you add stays on your device.