
Catalogue app
Local public accounts
A municipality is understood through its cash flows. Eight dashboards over official sources — spending, revenue, funded projects, procurement — with the regional ranking, the forecast and the anomalies computed in your browser.
The app travels inside the link: it opens in your browser and stays there. No account, nothing to install, and none of your data passes through a server.
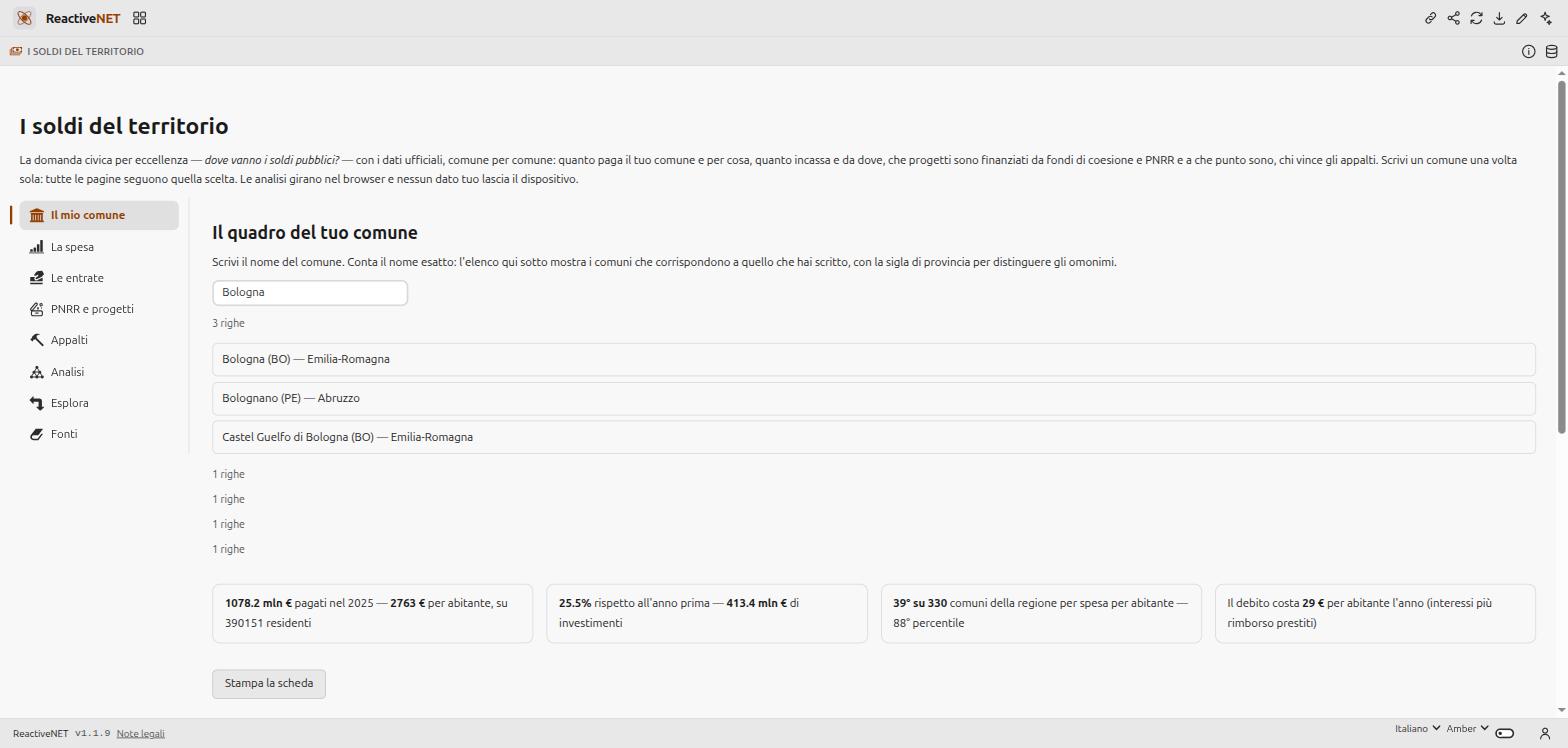
The app is written in Italian, because the data it reads is Italian and so are the people it is for. Everything below describes what it does.
What it does
You type the name of a municipality and eight pages fill with official data, joined to each other by the ISTAT code.
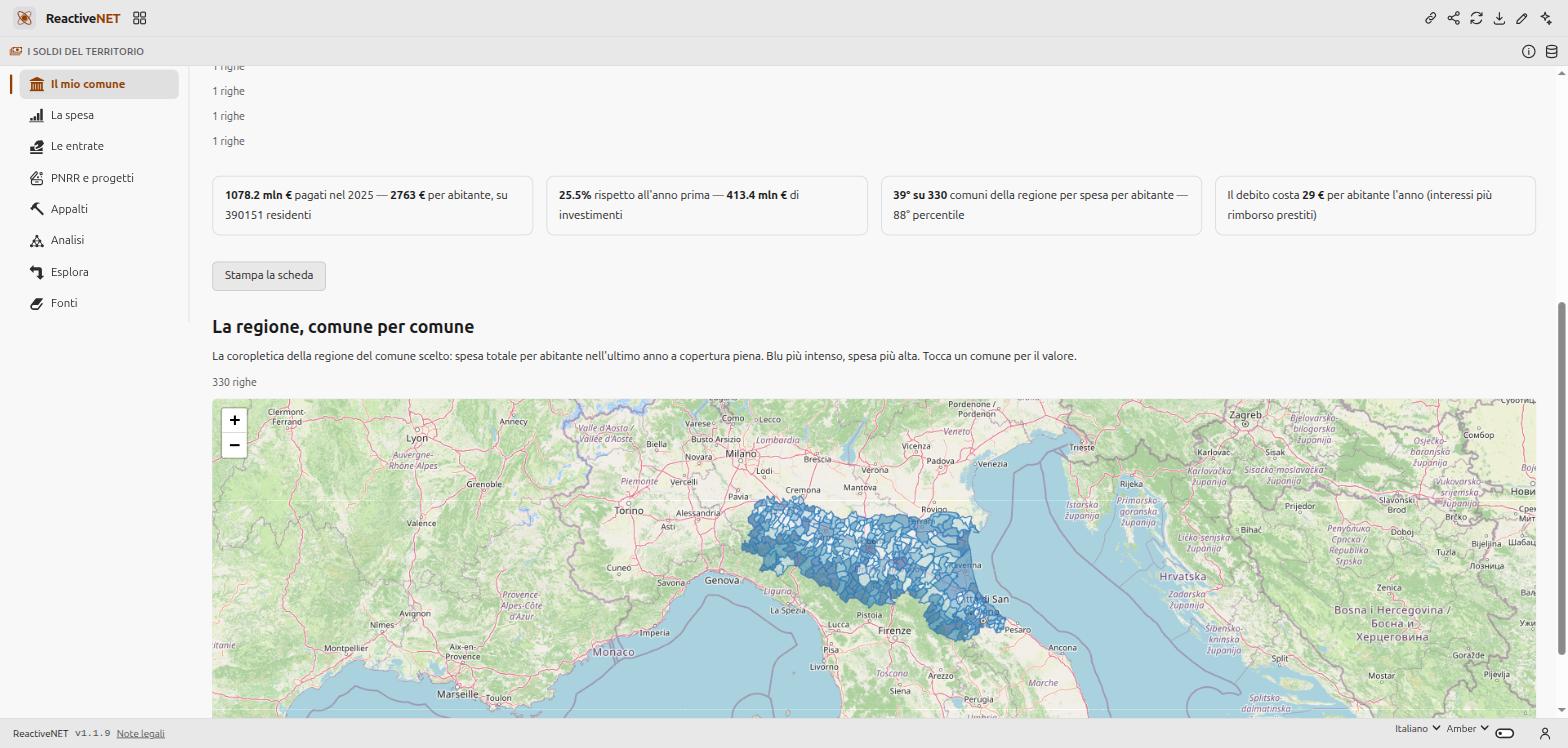
My municipality is the overview: last closed year’s spending and how it moved, spending per resident, position in the regional ranking, debt exposure. Below it, a choropleth of the region’s municipalities shaded by per-resident spending — where yours sits among the others, which is the only way to know whether a figure is high or low.
Spending and Revenue open the two sides of the cash accounts: the SIOPE categories year by year, the comparison with the region’s population bands, the balance between what came in and what went out, financial autonomy — how much of its revenue the municipality raises itself — and how much comes from fines.
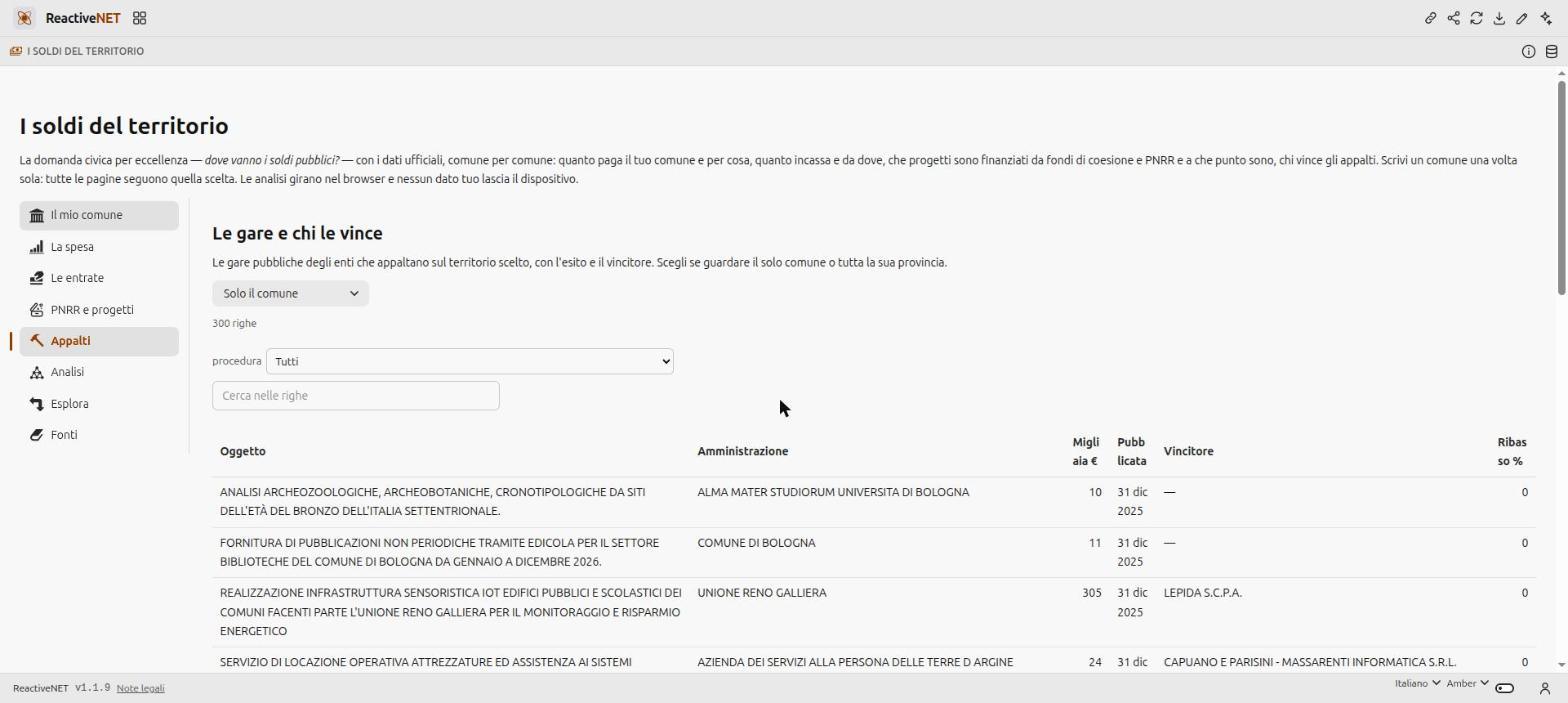
Recovery fund and projects lines up what has been financed: the themes cohesion money arrived on, the individual projects with their progress and their beneficiary, and the interventions recorded in OpenCUP with the body responsible. Procurement looks at the last two years of tenders: amounts, award procedures, the recovery-fund share, and for each one who won it and at what discount.
Analysis is the part that computes rather than displays: a forecast of spending over the five closed years, the anomalies an Isolation Forest finds with an adjustable sensitivity, and the municipalities whose spending profile is closest to yours — useful for knowing who it actually makes sense to compare against. Explore hands the reader the pivot table, and Sources declares every dataset with its licence.
Where the data comes from
| Source | What it provides | Coverage |
|---|---|---|
| MEF-RGS — SIOPE / OpenBDAP | every municipality’s cash receipts and payments | historical series, closed years |
| Cohesion Agency — OpenCoesione | funded projects, themes, status, beneficiaries | programming cycles |
| DIPE — OpenCUP | public interventions with responsible body and cost | since the CUP register |
| ANAC | tenders, amounts, procedures, winners and discounts | 2024–2025 |
| ISTAT | municipal boundaries for the maps | — |
What the app does not claim, and why
The ANAC archive in the warehouse covers two years: the Procurement page is not the municipality’s history of tenders, it is what moved in that period, and the page says so. The spending forecast rests on five points — the five closed years available — so it is an extrapolation, not a budget. SIOPE figures are cash flows: they say what was paid and received, not what was committed, which is a different and usually larger thing.
How you change it
It is a Markdown document: every query is there to read, and changing one is a line. If your municipality reasons differently — a spending category that matters more to you than the others, a comparison with neighbouring municipalities rather than with the population band — that is a change you make yourself, or ask the assistant to make.
Yours to change
An app is a Markdown document: open it, edit it by hand, or ask the assistant to change it for you. Whatever you add stays on your device.